
How to Put a 13-Year-Old’s Fastball in Context
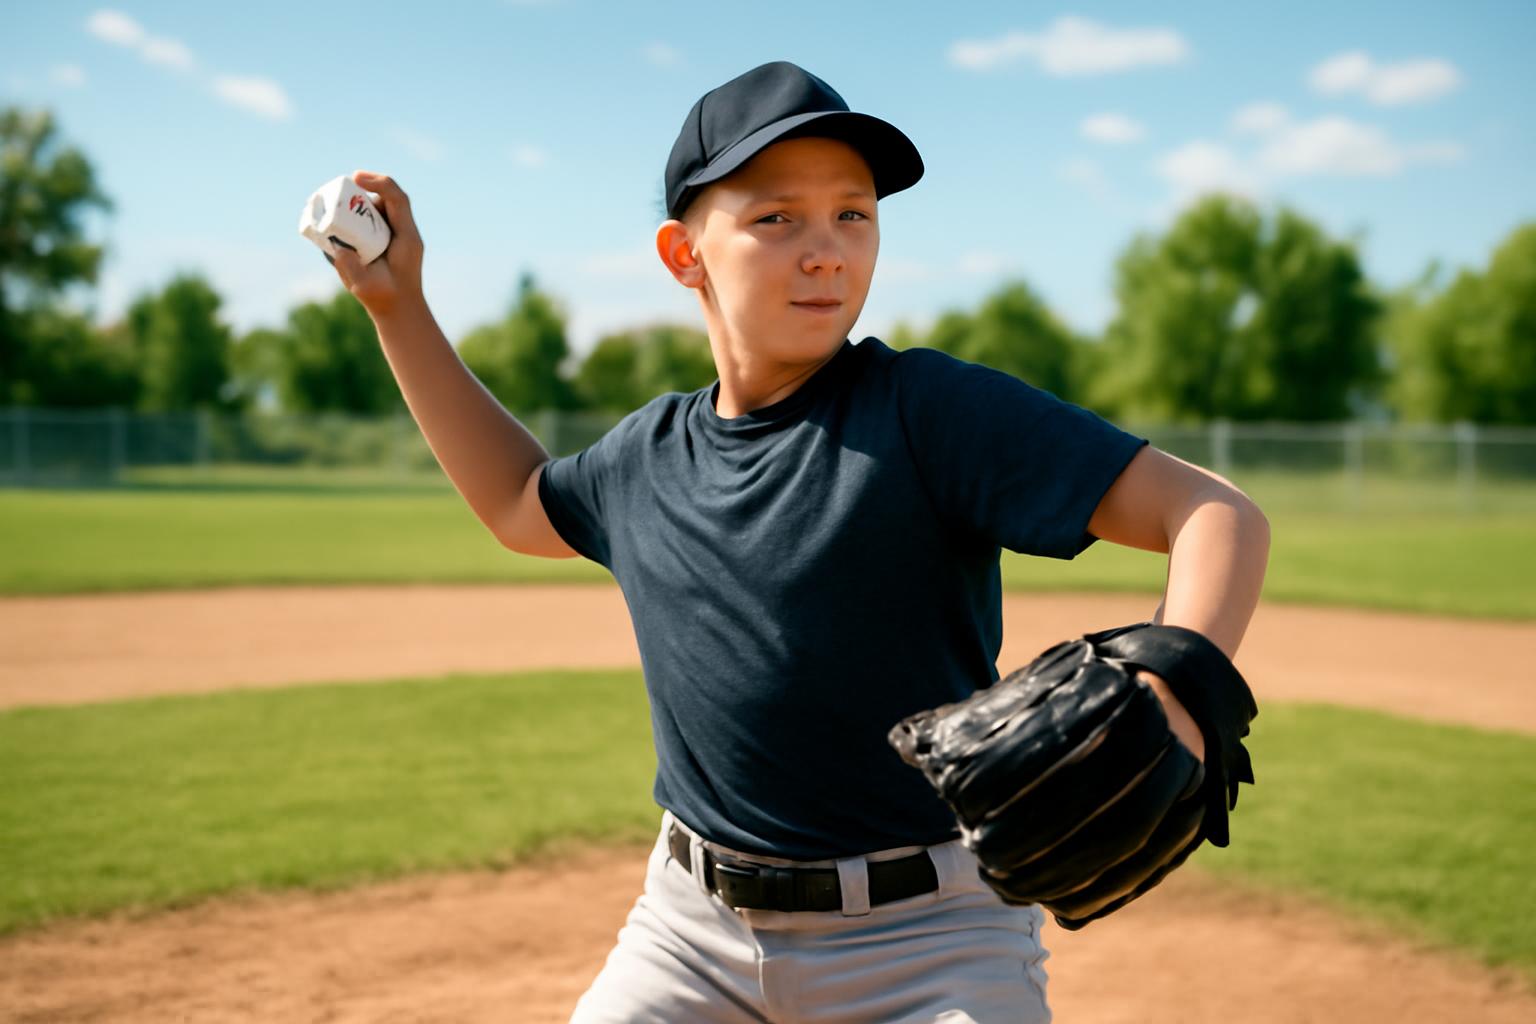
Limited guidance puts the cautious general baseball reference in the mid-50s to low-60s mph. At 65-70 mph, advanced or showcase context matters.
The short answer: mid-50s to low-60s mph is a reasonable general reference
For families searching for the average pitching speed for a 13-year-old, the available guidance supports a cautious answer: roughly the mid-50s to low-60s mph for a baseball fastball.12
That is a practical reference range, not a measured population-wide average or a pass-fail standard. The available sources use different definitions and player populations, and the general guides do not disclose representative samples or consistent measurement procedures.
One commercial article reports 54 mph as the average at age 13. Although it attributes the figure to published research, the article does not adequately explain the underlying population, pitch type, sample, or testing procedure. The number is best treated as a reported estimate rather than a settled norm.1
A pitching-training provider gives a broader reference, describing a 13-year-old as typically sitting 55–65 mph. That guide does not provide a dataset, sample size, or measurement protocol, so its range represents practical guidance rather than a calculated population average.2
A range is more honest than a single target because recreational, travel, select, and showcase pitchers do not necessarily come from comparable groups. The difference becomes clear in an analysis of selected competitive records: among the age-13 showcase pitchers studied, the reported benchmarks were 60 mph at the 25th percentile, 65 mph at the median, and 70 mph at the 75th percentile.3
Age-13 baseball velocity references at a glance
| Reported benchmark | Source population or context | How to use it | Main limitation |
|---|---|---|---|
| 54 mph reported average1 | General age-based estimate repeated by a commercial vendor | A rough general reference | The available article does not clearly disclose the population, pitch type, sample, or measurement method |
| 55–65 mph typical range2 | Guidance from a pitching-training provider | A broad practical reference for many age-13 baseball pitchers | It is an uncited typical range, not a calculated population norm |
| 60 mph at the 25th percentile3 | Selected competitive showcase and scouting records | Context for a pitcher competing in similar events | Preliminary web-scraped analysis; sample size was not stated, and measurement procedures may have varied |
| 65 mph at the 50th percentile3 | Selected competitive showcase and scouting records | An approximate midpoint within that selected group | It is not the median for every 13-year-old; the analysis may also be affected by extraction and measurement differences |
| 70 mph at the 75th percentile3 | Selected competitive showcase and scouting records | A high competitive benchmark | It is neither a universal standard nor a recommended target |
The practical takeaway is that a fastball in the mid-50s to low-60s can be compatible with the broad guidance available for age 13.12 Readings in the mid-to-upper 60s may be advanced in a general youth context while being less unusual within a selected showcase population.
These are baseball figures. Fastpitch softball uses a different pitching motion, playing context, and set of benchmarks, so its numbers should not be combined with the baseball table.
Why published answers range from 54 to 65 mph
Much of the apparent disagreement disappears when the statistical terms and comparison populations are separated.
-
An average usually means an arithmetic mean: the total of all readings divided by the number of observations.
-
A typical range is a descriptive band. It may reflect practical experience rather than a formal calculation.
- A percentile describes a result’s position within a specific distribution.
- An advanced tier groups players according to an author’s developmental or performance criteria.
- An elite label has no universal definition and may mean different things across programs, articles, and scouting settings.
These labels are not interchangeable. A source that says “typical” is not necessarily reporting a measured average. A showcase median is not automatically the average for the entire youth population. An advanced range intentionally describes only part of an age group.
The comparison group changes the answer
Consider three possible groups:
- everyone who pitches in a local age-13 recreational league;
- experienced travel or select pitchers; and
- pitchers who appear in scouting records or attend showcase events.
The second and third groups are selected differently from the first. The showcase analysis specifically concerned competitive pitchers who generally attended scouting events or played select baseball. A midpoint calculated from that population cannot be assumed to represent every 13-year-old pitcher.
That is why a reported general estimate of 54 mph and a selected-showcase median of 65 mph do not necessarily conflict.13 They describe different evidence sources, populations, and methods.
The showcase analysis reported 60, 65, and 70 mph at the 25th, 50th, and 75th percentiles, respectively, for its age-13 group.3 Its author cautioned against treating the selected group’s median as a universal average.
The analysis also has important methodological limitations. It used web-scraped public scouting records, did not state a sample size in the supplied account, and may be vulnerable to extraction errors. Readings may have come from different radar equipment or procedures. It was also cross-sectional, comparing athletes at particular ages rather than following the same players over time.
The 54 mph estimate has a different weakness.1 It is repeated in a commercial article, but the available explanation does not establish who was measured, whether the reported velocity represented a peak or an average, which pitch type was included, or how the measurement equipment was positioned.
Neither figure should be stretched beyond what its source supports. The lower number is best treated as a rough general estimate. The higher median is useful when comparing a pitcher with a similarly selected competitive group.
When reading any age-based velocity chart, ask:
- Does it describe all players or only competitive pitchers?
- Is the figure a mean, median, range, percentile, or skill tier?
- Does it represent peak velocity, several pitches, or game readings?
- Were the same equipment and testing procedures used?
- How large and representative was the sample?
- Is the source publishing measured data or practical coaching guidance?
If those questions are unanswered, the chart may still offer context, but it should not be treated as a precise ranking system.
What 55, 60, 65, and 70 mph mean at age 13
Velocity is best interpreted through scenarios rather than rigid labels. The same reading can look ordinary, strong, or relatively low depending on the comparison population and how the number was recorded.
Around 55 mph
A fastball in the mid-50s fits the broad general guidance available for age 13. It is close to the reported 54 mph estimate and falls within the separate 55–65 mph typical range.12
It should not be labeled deficient merely because it falls below a showcase benchmark. A local-league pitcher is not necessarily being evaluated against the same population as a pitcher whose velocity appears in competitive scouting records.
The more useful questions are whether the pitcher throws strikes, can repeat the delivery, performs effectively at the current level, and shows a consistent pattern rather than one isolated radar result.
Around 60 mph
A 60 mph fastball can reasonably be described as solid for a 13-year-old. It falls within the broad general guidance and equals the 25th-percentile benchmark in the selected showcase analysis.23
That does not place the pitcher at the 25th percentile among all 13-year-olds. It only identifies where that reading fell within the particular competitive distribution.
Around 65 mph
A 65 mph fastball is advanced relative to the general estimates discussed here. It is at the top of the published typical range and approximately the median among the selected showcase pitchers.23
Another expert-oriented article describes advanced 13-year-olds as often throwing 61–64 mph, while placing later-developing players below 60 mph.4 Those are developmental skill tiers, not population statistics, and the article does not provide an underlying dataset or measurement method.
How the result was obtained still matters. Touching 65 once in a controlled session is different from averaging 65 over several fastballs or regularly showing that velocity in games.
Around 70 mph
A 70 mph fastball is unusually fast relative to the broad general guidance. Within the selected showcase distribution, however, it was approximately the 75th-percentile benchmark.23
That does not make 70 mph a target every 13-year-old should pursue. It describes a strong result within an already competitive group, not a minimum requirement for development or future success.
Scenario-based comparison
| Observed fastball velocity | Reasonable interpretation | Relevant comparison population | What the number does not prove |
|---|---|---|---|
| 55 mph12 | Compatible with broad general guidance | General youth baseball | That the player is behind because the reading is below showcase figures |
| 60 mph23 | Solid generally; the lower reported benchmark in the selected showcase distribution | General players and, with caution, competitive showcase pitchers | A universal percentile across all 13-year-olds |
| 65 mph23 | Advanced relative to broad guidance; near the selected showcase median | Experienced select or showcase pitchers | Future varsity status, recruiting value, or adult velocity |
| 70 mph3 | Unusually fast generally; around the selected showcase 75th percentile | Higher-velocity competitive showcase pitchers | That every pitcher should pursue 70 mph or that future success is guaranteed |
This table is not a talent forecast. None of these readings alone predicts varsity selection, recruiting prospects, adult velocity, or long-term potential. A single number at age 13 captures only one aspect of a player’s current performance.
Chronological age does not capture physical development
“Age 13” places players in the same calendar category, but it does not put them at the same stage of physical development.
Two players with similar birthdays may differ substantially in body size, muscle development, strength, leverage, coordination, growth timing, and baseball experience. One expert-oriented discussion identifies developmental age, physical size, strength, puberty timing, mechanics, and experience as important context for youth pitching velocity.4
Developmental or biological maturity is context, not a diagnosis for parents to assign at home. The point is not to label a child permanently as an early or late developer. It is to recognize that chronological age alone cannot explain every difference on a radar gun.
The same expert discussion describes velocity development as uneven rather than linear, with possible jumps, plateaus, and setbacks.4 That has several practical consequences.
First, a later-developing player throwing below 60 mph is not automatically behind.4 A lower reading may simply reflect the player’s present combination of maturity, experience, mechanics, and measurement conditions.
Second, families should not expect a fixed annual increase. Adding the same number of miles per hour to a projection every year ignores variation in growth timing and the coordination adjustments that can accompany physical change.
Third, training cannot guarantee that players of the same age will progress on the same timeline. Instruction may help a player use current abilities more effectively, but the available evidence does not support promising a particular radar result.
Finally, temporary rankings can change. Being the hardest thrower at 13 does not establish who will throw hardest later, and modest velocity at 13 does not determine a player’s eventual ceiling.
Age charts are therefore comparison tools, not minimum requirements. They can help answer, “What context might fit this reading?” They cannot reliably answer, “What will this player become?”
How to make radar readings more comparable
A radar reading looks precise because it produces a number, but the testing context matters. Pitch type, warm-up, effort, fatigue, practice versus game conditions, radar placement, equipment, and the method used to choose the reported result can all affect the comparison.
Consider these statements:
- “The pitcher touched 63.”
- “The pitcher averaged 63 across eight fastballs.”
- “The pitcher generally sits around 63 in games.”
They describe three different things: a maximum, a multi-pitch summary, and a typical competitive range. Comparing one category with another can create a misleading impression of progress or relative standing.
An informal consistency protocol
The following is a practical tracking method, not a validated laboratory standard:
- Use the same device. Changing among a radar gun, a phone-based estimate, and facility equipment makes trends harder to interpret.
- Use the same location and setup. Keep the radar position, throwing distance, mound or flat-ground context, and target arrangement as consistent as practical.
- Measure the same pitch type. Compare fastballs with fastballs rather than mixing pitch types or unspecified throws.
- Use a similar warm-up. Do not compare a reading taken almost immediately with one recorded after a complete throwing progression.
- Record several pitches. A sequence provides more context than one unusually high or low result.
- Apply the same summary method. If you record the average of a fixed number of valid fastballs, continue using that method. If you record the best pitch, label it as peak velocity.
- Record the setting. Note whether the reading came from practice, a bullpen, a lesson, or a game.
- Review trends over months. Avoid drawing large conclusions from one session.
Keep separate records for:
- Peak velocity: the fastest valid fastball in the session;
- Several-pitch average: a consistently calculated summary of multiple fastballs; and
- Game velocity: the range the pitcher generally shows while competing.
Each answers a different question. Peak velocity records the highest output observed under those conditions. Game velocity describes what the pitcher shows while facing hitters.
Equipment differences add another complication. One fastpitch softball coach reports observing differences of at least 2–3 mph between devices, but that is experience-based guidance from a softball setting and should not be generalized as a universal margin for baseball radar equipment.5 The defensible conclusion is simply that equipment and setup differences can interfere with direct comparison.
That same caution applies to showcase records. When readings come from multiple events or facilities with different equipment, placements, or procedures, small differences between athletes may reflect measurement variation as well as actual throwing velocity.3
Consistency does not turn informal tracking into laboratory measurement. It can make a player’s personal trend more interpretable than a collection of isolated readings gathered under changing conditions.
Velocity is only one part of effective pitching
Velocity is relevant to pitching performance, but a few additional miles per hour do not by themselves establish that a 13-year-old is more effective or developing appropriately.
A fuller baseball evaluation considers:
- strike throwing;
- command within and around the strike zone;
- repeatable mechanics;
- appropriate pitch quality and speed variation;
- execution under game pressure;
- the player’s usual recovery pattern;
- awareness of total throwing activity;
- enjoyment and willingness to participate; and
- whether the player reports pain.
The available coaching guidance emphasizes mechanics, control, recovery, workload awareness, and long-term development rather than treating radar velocity as the only objective.24
A pitcher who records a high maximum but cannot repeat the delivery may be less effective in games than one who throws somewhat slower and locates pitches consistently. A mechanical adjustment should be assessed in the context of the whole delivery, not through a promised velocity gain.
Families should also distinguish training from testing. Periodic readings under comparable conditions can document a trend. Not every throwing session needs to become an attempt to establish a new maximum.
This article does not provide pitch-count rules, mandatory rest periods, medical diagnoses, treatment, or return-to-play instructions. Those decisions require the applicable league or governing rules and, when symptoms or health concerns are involved, appropriately qualified professional guidance.
A parent-facing review can keep the discussion grounded:
- Is the pitcher throwing strikes?
- Can the pitcher repeat the delivery reasonably well?
- How does the pitcher usually feel and recover after throwing?
- Is the player still enjoying participation?
- Has the player reported pain or another concern that should be evaluated?
Positive answers do not prove that a player is free from risk. They simply prevent the radar number from becoming the only information considered.
Fastpitch softball uses different benchmarks
No—the baseball figures in this article do not apply to fastpitch softball.
The two sports use different pitching motions and competitive contexts, and their benchmark charts come from different sources. Combining the figures into one age-13 pitching average would create a misleading comparison.
Fastpitch softball reference—not baseball
Age-13 fastpitch category Reported range Experience-based average range 45–53 mph5 Experience-based high-end range 54–56 mph5
A fastpitch coaching guide lists 45–53 mph as its age-13 average range and 54–56 mph as its high-end range.5 The author explains that the broader guidance for ages 12–14 includes both beginners and pitchers with several years of experience.
These figures are based on coaching experience and are presented as guides rather than representative population statistics. Mechanics, experience, physical development, practice versus game conditions, equipment, and testing procedures may all affect the individual reading.
A family evaluating a softball pitcher should compare that player with other fastpitch pitchers of similar age and experience—not with overhand baseball fastballs.
A practical way to evaluate a 13-year-old pitcher
A radar reading becomes useful when it leads to better questions rather than an automatic judgment. Families can use a four-step framework.
1. Identify the correct comparison population
Start with the player’s competitive setting.
Is this a first-year recreational pitcher, a regular local-league starter, an experienced travel player, or an athlete attending showcases? A benchmark drawn from one group may be inappropriate for another.
Broad age guidance is usually the more relevant starting point for recreational and local players. Showcase percentiles become more relevant only when the player is competing in a genuinely comparable setting.
2. Verify how the reading was measured
Determine whether the number is:
- a one-pitch maximum;
- an average across several fastballs;
- a usual bullpen range;
- a game reading; or
- an estimate from equipment with an unknown setup.
A number without a measurement description is much less informative. If ongoing tracking matters, repeat the same informal protocol rather than comparing unrelated readings from different devices and environments.
3. Consider maturity and experience
Ask how long the player has pitched, how often the player practices, and whether recent physical growth has affected coordination or body control. Do not assume that two players of the same chronological age should produce the same result.4
This context is neither an excuse nor a prediction. It simply prevents the radar gun from being treated as though every 13-year-old has the same physical and experiential starting point.
4. Evaluate velocity alongside the rest of pitching
Consider command, strike throwing, repeatability, pitch quality, game execution, the player’s normal recovery pattern, total throwing activity, enjoyment, and reported pain.
The next decision should not automatically be “start velocity training.” The better question is whether the player’s overall pitching development is effective, repeatable, and appropriate for the player’s current setting.
Three realistic examples
A recreational pitcher at 56 mph
A 56 mph fastball fits within the broad general guidance.12 There is no basis for calling the pitcher behind simply because the result falls below selected showcase benchmarks.
The next questions should concern strikes, delivery consistency, game effectiveness, and how the reading was obtained. Comparing this pitcher directly with a showcase median would mix two different populations.
A travel or competitive pitcher at 60 mph
A 60 mph fastball is solid within the broad guidance and matches the lower reported benchmark—the 25th percentile—in the selected showcase distribution.23
That does not make it a universal 25th-percentile result. The reading should be considered alongside command, movement, sequencing, and game execution.
A showcase pitcher at 65 mph
A 65 mph fastball is advanced relative to broad general guidance and approximately the median within the cited showcase sample.23 For a pitcher attending similar events, that selected competitive distribution is more relevant than it would be for a recreational player.
Even in this setting, the next step should not automatically be velocity-focused training. Families should first determine whether the reading is repeatable, whether it appears in games, and how it fits the pitcher’s overall development.
The central rule is compare like with like. Do not build expectations from social-media claims, isolated maximum readings, or unlabeled charts whose population, equipment, and testing setup are unknown.
There is no single pass-fail radar number for a 13-year-old. The limited published guidance supports the mid-50s to low-60s mph as a cautious general baseball reference, while readings around 65–70 mph are better understood in the context of advanced players or selected showcase populations.23 Consistent measurement, maturity context, command, repeatable mechanics, and the player’s broader participation experience tell a fuller story than one maximum reading.
Frequently asked questions
Is 60 mph good for a 13-year-old pitcher?
Yes. A 60 mph fastball can reasonably be described as solid for a 13-year-old. It falls within the broad general guidance and matches the 25th-percentile benchmark in the selected competitive-showcase analysis.23
That percentile applies only to the cited competitive group. A repeatable game reading also means something different from touching 60 once during practice.
Is 65 mph fast for a 13-year-old?
Yes. A 65 mph fastball is advanced relative to the broad general estimates. It is also approximately the median in the selected showcase distribution, which demonstrates why the comparison population matters.23
The reading is notably fast in a broad youth context but closer to the middle among the selected showcase pitchers. It does not predict future level or adult velocity.
How unusual is a 70 mph fastball at age 13?
A 70 mph fastball is unusually fast compared with broad age-13 guidance. In the selected competitive-showcase analysis, it was approximately the 75th-percentile benchmark.23
It is a strong result even within that faster, selected population. It should be treated as context, not as a target every 13-year-old needs to reach.
Should parents worry if a 13-year-old throws below 60 mph?
Not based on the radar number alone. The available developmental guidance specifically places some later-developing 13-year-olds below 60 mph and emphasizes differences in maturity, body size, strength, experience, and mechanics.4
Parents should consider how the reading was measured and evaluate the pitcher’s command, repeatability, participation experience, and reported symptoms.
What is the average fastpitch softball speed for a 13-year-old?
One experience-based fastpitch coaching guide lists 45–53 mph as the average range for age 13 and 54–56 mph as the high-end range.5
These are practical coaching estimates, not representative population statistics. They apply to fastpitch softball rather than baseball, and individual readings can vary with experience, development, conditions, equipment, and testing procedures.
-
MaxBP’s age-based pitching discussion reports the 54 mph estimate but does not fully disclose the underlying population or measurement method. ↩↩↩↩↩↩↩↩↩
-
Premier Pitching Performance’s velocity guide describes 55–65 mph as typical for a 13-year-old without providing a supporting dataset or testing protocol. ↩↩↩↩↩↩↩↩↩↩↩↩↩↩↩↩↩↩↩
-
Joe Eisenmann’s competitive-pitcher analysis reports the selected age-13 showcase percentiles and discusses why they should not be generalized to all pitchers. ↩↩↩↩↩↩↩↩↩↩↩↩↩↩↩↩↩↩↩
-
Professional Baseball Strength’s developmental guidance discusses developmental age and presents advanced and later-developing velocity tiers rather than population statistics. ↩↩↩↩↩↩↩
-
Fastpitcher’s experience-based softball guide provides the age-13 softball ranges and notes that they are practical guides rather than fixed standards. ↩↩↩↩↩